ANALYSIS OF NETWORK
- CLIENT/SERVER APP
Findings of the data and analysis performed since
July 25, 2001 from the Test Client Workstation(134.248.212.242) in El
Segundo.:
1.
VIEW MANAGER LOADING
This measures the launch of the View Manager.
Time = 20:00 July 25, 2001
Network Utilization (Averaged 5 minute) = 70kbps = 4.56%
Actual Average Round Trip Latency to Matador = 25ms
Packets transferred = 3723
Amount of Data Transferred = 1,084,746 Bytes
Actual Transaction Time = 60.38 seconds
Delay attributed to WAN Latency:
- Packet Latencies
3723 x 25ms/2 = 46.58sec
- Data Transfer Latency
(1,084,746 Bytes x 8 bits/Byte)/1,536,000 bits/sec = 5.64 sec
Delay attributed to Server/Client Workstation:
60.38 - 46.58 - 5.64 = 8.16sec
From the NetEQuality Network Monitor Server that
has been tracking the network performance, we have the following results
for the Brea - El Segundo Frame Relay Link:
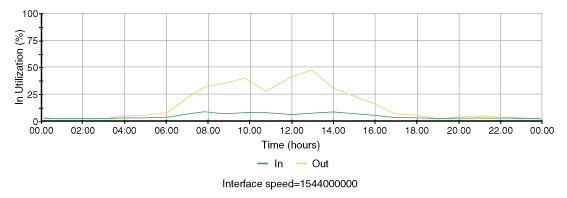
Inbound into El Segundo from Brea:
Maximum 90th Percentile Utilization = 40%
Minimum 90th Percentile Utilization = 4%
Outbound from El Segundo to Brea:
Maximum 90th Percentile Utilization = 15%
Minimum 90th Percentile Utilization = 4%
Round Trip Latency from Client Workstation in El
Segundo to Brea Server on 134.248.1.0 network:
Maximum 90th Percentile = 60ms
Minimum 90th Percentile = 30ms
EXTRAPOLATION FROM ABOVE DATA:
Maximum Packet Latencies = 3723 x 60ms/2 =
111.69sec
Data Transfer Latency = (1,084,746 Bytes x 8 bits/Byte)/60%x1,536,000
bits/sec = 9.42sec
Delay Attributed to Server/Workstation = 8.16sec
MAXIMUM VIEW MANAGER LOAD TIME = 129.27sec
MINIMUM VIEW MANAGER LOAD TIME = actual results
from 20:00 July 12 test = 60.38sec
ANALYSIS
From the above data and extrapolations, we can see
that the View Manager Load Time is highly sensitive to the network
latency. This is due to the large number of data packets that is
required for this transaction. Once of the ways to speed up this
transaction would be to lower the number of data packets, as the latency
of 100ms on a WAN is considered to be good within the Continental North
America.
Attached to this email is the packet capture for
this transaction: VIEWMG10.XLS
Please note that there is a large number of:
SQL
Error return status
There may be nothing wrong with this, but it is
worth to look at to see whether we are in an error loop. This
packet capture may be helpful in reducing the number of packets.
2. OPEN VIEW >> AD HOC >> LOG ON
This transaction is done in the View Manager.
It opens the Ad Hoc View, which prompts for a Username and Password.
The timing starts from clicking the “OK” until the data is returned
in the Window.
Time = 21:30 July 25, 2001
Network Utilization (Averaged 5 minute) = 32kbps = 2.08%
Actual Average Round Trip Latency to Matador = 20ms
Packets transferred = 1050
Amount of Data Transferred = 265,558 Bytes
Actual Transaction Time = 15.33 seconds
Delay attributed to WAN Latency:
- Packet Latencies
1050 x 20ms/2 = 10.50sec
- Data Transfer Latency
(265,558 Bytes x 8 bits/Byte)/1,536,000 bits/sec = 1.38 sec
Delay attributed to Server/Client Workstation:
15.33 - 10.50 - 1.38 = 3.45sec
From Network Monitor Data in (1) above.
Round Trip Latency from Client Workstation in El Segundo to Brea Server
on 134.248.1.0 network:
Maximum 90th Percentile = 60ms
Minimum 90th Percentile = 30ms
EXTRAPOLATION FROM ABOVE DATA:
Maximum Packet Latencies = 1050 x 60ms/2 = 31.50sec
Data Transfer Latency = (265,558 Bytes x 8 bits/Byte)/60%x1,536,000
bits/sec = 2.31sec
Delay Attributed to Server/Workstation = 3.45sec
MAXIMUM AD HOC VIEW OPEN TIME = 37.26sec
MINIMUM AD HOC VIEW OPEN TIME = actual results
from 21:30 July 12 test = 15.33sec
ANALYSIS
From the above data and extrapolations, we can see
that the Ad Hoc View Open Time is again sensitive to the network
latency. This is due to the large number of data packets that is
required for this transaction. Once of the ways to speed up this
transaction would be to lower the number of data packets, as the latency
of 100ms on a WAN is considered to be good within the Continental North
America.
Attached to this email is the packet capture for
this transaction: AHLOGON2.XLS
3. AD HOC UNLOCK
This transaction is done in the View Manager,
after the Ad Hoc View has been opened and the Lock Button Clicked.
The timing starts from clicking the “Unlock” until the “Lock”
Button is returned.
Time = 21:45 July 25, 2001
Network Utilization (Averaged 5 minute) = 59kbps = 3.84%
Actual Average Round Trip Latency to Matador = 20ms
Packets transferred = 1817
Amount of Data Transferred = 438,537 Bytes
Actual Transaction Time = 84.50 seconds
Delay attributed to WAN Latency:
- Packet Latencies
1817 x 20ms/2 = 18.17sec
- Data Transfer Latency
(438,537 Bytes x 8 bits/Byte)/1,536,000 bits/sec = 2.28 sec
Delay attributed to Server/Client Workstation:
84.50 – 18.17 – 2.28 = 64.05sec
From Network Monitor Data in (1) above.
Round Trip Latency from Client Workstation in El Segundo to Brea Server
on 134.248.1.0 network:
Maximum 90th Percentile = 60ms
Minimum 90th Percentile = 30ms
EXTRAPOLATION FROM ABOVE DATA:
Maximum Packet Latencies = 1817 x 60ms/2 = 54.51sec
Data Transfer Latency = (438,537 Bytes x 8 bits/Byte)/60%x1,536,000
bits/sec = 3.81sec
Delay Attributed to Server/Workstation = 64.05sec
MAXIMUM AD HOC VIEW OPEN TIME = 122.37sec
MINIMUM AD HOC VIEW OPEN TIME = actual results
from 21:30 July 12 test = 84.50sec
ANALYSIS
From the above data and extrapolations, we can see
that the Ad Hoc Unlock Time is sensitive to the network latency.
This is due to the large number of data packets that is required for
this transaction. Once of the ways to speed up this transaction
would be to lower the number of data packets, as the latency of 100ms on
a WAN is considered to be good within the Continental North America.
But more importantly, there is a 64sec delay due
to the server Matador. Matador did not respond the request from
the Client Workstation for 61sec at Packet#936 in the attached packet
capture: AHUNLO4.XLS.
|